Biological Data Visualization Market
Global Biological Data Visualization Market Size, Share & Trends Analysis Report by Technology (Magnetic Resonance Imaging, Microscopy, Sequencing, and Others), By Application (Genomic Analysis, Cell Biology, Molecular & Structural Analysis, and Others), By End-User ( Pharmaceutical & Biotechnology Companies, Research Institutes, Hospitals and Clinics) and Forecast 2020-2026 Update Available - Forecast 2025-2035
The global market for biological data visualization is estimated to have a significant CAGR during the forecast period. The market is mainly driven due to growing biological data that further encourage the demand of data visualization. With the growing big data concerns, the researchers have shifted their focus towards data visualization due to advent of AI in maintaining the biological data. The platform offers flexibility to the users to pay as per their usage of cloud services, including software, hardware infrastructure, and platforms to solve biomedical computation concerns. It offers on-demand storage and analysis facility to the users which makes it an emerging computing platform to address big data concerns. Owing to the flexibility and cost-effectiveness, biological data visualization has been gaining significant importance in cell biology and genomics studies. For instance, large datasets and applications for gene sequencing, image analysis, protein folding, and data mining can be shared for collaborative research between facilities with the use of AI platforms.
Segmental Outlook
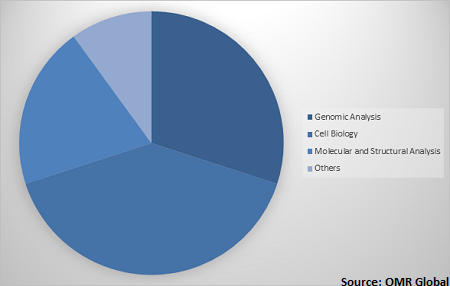
The global biological data visualization market is segmented based on technology application, and end-user. Based on the technology, the market is further classified into magnetic resonance imaging, microscopy, sequencing, and others(x-ray crystallography). The sequencing segment is projected to have considerable share owing to the high demand of next generation sequencing technology for biological data analysis. Based on the application, the global biological data visualization market is further segmented into genomic analysis, cell biology, molecular & structural analysis, and others. The genomic analysis segment id projected to have significant market growth owing to the rising genomic based research couple with integration of advanced technology such as AI in genomic studies. Based on end-user the market is segregated into
Global biological data visualization Market Share by Application, 2019(%)

Global biological data visualization Market to be driven by genomic application
The genomic analysis segment held a considerable growth in the market owing to the growing genomic research for drug discovery and adoption of advanced image analysis technology. Significant rise in genomic researches has been primarily reported owing to the increasing number of drug discoveries by pharma companies. As per the European Federation of Pharmaceutical Industries and Associations (EFPIA), in Europe, pharmaceutical R&D increased from 3.0% in 2009-2013 to 3.8% in 2014-2018. In the US, it was increased from 2.9% in 2009-2013 to 8.6% in 2014-2018. This growth in pharma R&D results in the rising number of drug discoveries, which contributes to the increasing demand for genomic researches to obtain knowledge of all human genes and accordingly plan for drug discovery processes therefore creating significant demand of biological data visualization solutions.
Regional Outlook
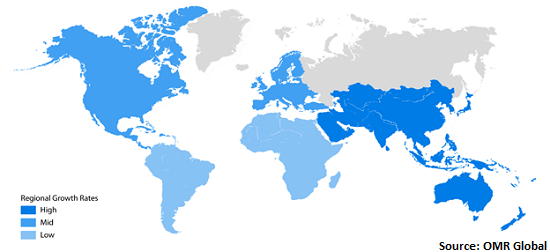
Geographically, the global biological data visualization market is further classified into North America, Europe, Asia-Pacific and the Rest of the World. Asia-Pacific is estimated to have considerable market growth in the global market during the forecast period. The market growth in the region is increasing owing to the growing digitalization in the healthcare sector coupled with integration of AI nad other advanced technologies. The major countries which will have a significant market share during the forecast period are India, China, and Japan. Apart from these nations, South Korea and Singapore are some of the other major economies where considerable growth would be observed.
Global biological data visualization Market Growth, by Region 2020-2026

North America to hold a considerable share in the global biological data visualization market
Geographically, North America is projected to hold a significant market share in the global biological data visualization market. Major economies which are anticipated to contribute to the North America market are the US and Canada. The factors that are contributing significantly to the growth of the market include R&D investment in the bio-pharmaceutical sector and high healthcare expenditure. The US bio-pharmaceutical industry invested around $90 billion in R&D in 2016. Biological sample visualization is one of the major components which is widely employed in drug discovery as well as in R&D program. As a result, the significant share has been contributed by the region. In addition, the well-developed pharmaceutical and bio-tech sector is strengthening the demand for biological visualization in the region.
Market Players Outlook
The key players in the biological data visualization market contributing significantly by providing different types of products and increasing their geographical presence across the globe. The key players of the market include Agilent Technologies, Inc., Becton, Dickinson and Co., Bruker Corp., QIAGEN GmbH, Thermo Fisher Scientific, Inc., and others. These market players adopt various strategies such as product launch, partnerships, collaborations, mergers, and acquisitions to sustain a strong position in the market.
The Report Covers
- Market value data analysis of 2019 and forecast to 2026.
- Annualized market revenues ($ million) for each market segment.
- Country-wise analysis of major geographical regions.
- Key companies operating in the global biological data visualization market. Based on the availability of data, information related to pipeline products, and relevant news is also available in the report.
- Analysis of business strategies by identifying the key market segments positioned for strong growth in the future.
- Analysis of market-entry and market expansion strategies.
- Competitive strategies by identifying ‘who-stands-where’ in the market.
1. Report Summary
1.1. Research Methods and Tools
1.2. Market Breakdown
1.2.1. By Segments
1.2.2. By Geography
2. Market Overview and Insights
2.1. Scope of the Report
2.2. Analyst Insight & Current Market Trends
2.2.1. Key Findings
2.2.2. Recommendations
2.2.3. Conclusion
2.3. Rules & Regulations
3. Competitive Landscape
3.1. Company Share Analysis
3.2. Key Strategy Analysis
3.3. Key Company Analysis
3.3.1. Agilent Technologies, Inc.
3.3.1.1. Overview
3.3.1.2. Financial Analysis
3.3.1.3. SWOT Analysis
3.3.1.4. Recent Developments
3.3.2. Becton, Dickinson and Co.
3.3.2.1. Overview
3.3.2.2. Financial Analysis
3.3.2.3. SWOT Analysis
3.3.2.4. Recent Developments
3.3.3. Bruker Corp.
3.3.3.1. Overview
3.3.3.2. Financial Analysis
3.3.3.3. SWOT Analysis
3.3.3.4. Recent Developments
3.3.4. QIAGEN GmbH
3.3.4.1. Overview
3.3.4.2. Financial Analysis
3.3.4.3. SWOT Analysis
3.3.4.4. Recent Developments
3.3.5. Thermo Fisher Scientific, Inc.
3.3.5.1. Overview
3.3.5.2. Financial Analysis
3.3.5.3. SWOT Analysis
3.3.5.4. Recent Developments
4. Market Determinants
4.1. Motivators
4.2. Restraints
4.3. Opportunities
5. Market Segmentation
5.1. Global Biological Data Visualization Market by Technology
5.1.1. Magnetic Resonance Imaging
5.1.2. Microscopy
5.1.3. Sequencing
5.1.4. Others(X-ray Crystallography)
5.2. Global Biological Data Visualization Market by Application
5.2.1. Genomic Analysis
5.2.2. Cell Biology
5.2.3. Molecular and Structural Analysis
5.2.4. Others( Alignments, Phylogeny)
5.3. Global Biological Data Visualization Market by End-User
5.3.1. Pharmaceutical & Biotechnology Companies
5.3.2. Research Institutes
5.3.3. Hospitals and Clinics
6. Regional Analysis
6.1. North America
6.1.1. United States
6.1.2. Canada
6.2. Europe
6.2.1. UK
6.2.2. Germany
6.2.3. Italy
6.2.4. Spain
6.2.5. France
6.2.6. Rest of Europe
6.3. Asia-Pacific
6.3.1. China
6.3.2. India
6.3.3. Japan
6.3.4. Rest of Asia-Pacific
6.4. Rest of the World
7. Company Profiles
7.1. 3M Co.
7.2. Agilent Technologies, Inc.
7.3. arivis AG
7.4. Becton, Dickinson and Co.
7.5. Bruker Corp.
7.6. Clarivate Analytics
7.7. Carl Zeiss AG
7.8. Danaher Corp.
7.9. Fios Genomics
7.10. Genialis, Inc.
7.11. Genedata AG
7.12. Media Cybernetics, Inc.
7.13. Molecular Devices, LLC
7.14. Nikon Corp.
7.15. Oxford Instruments
7.16. Olympus Corp.
7.17. Scientific Volume Imaging B.V.
7.18. Thermo Fisher Scientific, Inc.
7.19. TIBCO Software Inc.
7.20. QIAGEN GmbH
1. GLOBAL BIOLOGICAL DATA VISUALIZATION MARKET RESEARCH AND ANALYSIS BY TECHNOLOGY, 2019-2026 ($ MILLION)
2. GLOBAL MAGNETIC RESONANCE IMAGING MARKET RESEARCH AND ANALYSIS BY REGION, 2019-2026 ($ MILLION)
3. GLOBAL MICROSCOPY MARKET RESEARCH AND ANALYSIS BY REGION, 2019-2026 ($ MILLION)
4. GLOBAL SEQUENCING MARKET RESEARCH AND ANALYSIS BY REGION, 2019-2026 ($ MILLION)
5. GLOBAL OTHERS MARKET RESEARCH AND ANALYSIS BY REGION, 2019-2026 ($ MILLION)
6. GLOBAL BIOLOGICAL DATA VISUALIZATION MARKET RESEARCH AND ANALYSIS BY APPLICATION, 2019-2026 ($ MILLION)
7. GLOBAL BIOLOGICAL DATA VISUALIZATION IN GENOMIC ANALYSIS MARKET RESEARCH AND ANALYSIS BY REGION, 2019-2026 ($ MILLION)
8. GLOBAL BIOLOGICAL DATA VISUALIZATION IN CELL BIOLOGY MARKET RESEARCH AND ANALYSIS BY REGION, 2019-2026 ($ MILLION)
9. GLOBAL BIOLOGICAL DATA VISUALIZATION IN MOLECULAR AND STRUCTURAL ANALYSIS MARKET RESEARCH AND ANALYSIS BY REGION, 2019-2026 ($ MILLION)
10. GLOBAL BIOLOGICAL DATA VISUALIZATION IN OTHERS MARKET RESEARCH AND ANALYSIS BY REGION, 2019-2026 ($ MILLION)
11. GLOBAL BIOLOGICAL DATA VISUALIZATION MARKET RESEARCH AND ANALYSIS BY END-USER, 2019-2026 ($ MILLION)
12. GLOBAL BIOLOGICAL DATA VISUALIZATION IN PHARMACEUTICAL & BIOTECHNOLOGY COMPANIES MARKET RESEARCH AND ANALYSIS BY REGION, 2019-2026 ($ MILLION)
13. GLOBAL BIOLOGICAL DATA VISUALIZATION IN RESEARCH INSTITUTES MARKET RESEARCH AND ANALYSIS BY REGION, 2019-2026 ($ MILLION)
14. GLOBAL BIOLOGICAL DATA VISUALIZATION IN HOSPITALS AND CLINICS MARKET RESEARCH AND ANALYSIS BY REGION, 2019-2026 ($ MILLION)
15. GLOBAL BIOLOGICAL DATA VISUALIZATION MARKET RESEARCH AND ANALYSIS BY GEOGRAPHY, 2019-2026 ($ MILLION)
16. NORTH AMERICAN BIOLOGICAL DATA VISUALIZATION MARKET RESEARCH AND ANALYSIS BY COUNTRY, 2019-2026 ($ MILLION)
17. NORTH AMERICAN BIOLOGICAL DATA VISUALIZATION MARKET RESEARCH AND ANALYSIS BY TECHNOLOGY, 2019-2026 ($ MILLION)
18. NORTH AMERICAN BIOLOGICAL DATA VISUALIZATION MARKET RESEARCH AND ANALYSIS BY APPLICATION, 2019-2026 ($ MILLION)
19. NORTH AMERICAN BIOLOGICAL DATA VISUALIZATION MARKET RESEARCH AND ANALYSIS BY END-USER, 2019-2026 ($ MILLION)
20. EUROPEAN BIOLOGICAL DATA VISUALIZATION MARKET RESEARCH AND ANALYSIS BY COUNTRY, 2019-2026 ($ MILLION)
21. EUROPEAN BIOLOGICAL DATA VISUALIZATION MARKET RESEARCH AND ANALYSIS BY TECHNOLOGY, 2019-2026 ($ MILLION)
22. EUROPEAN BIOLOGICAL DATA VISUALIZATION MARKET RESEARCH AND ANALYSIS BY APPLICATION, 2019-2026 ($ MILLION)
23. EUROPEAN BIOLOGICAL DATA VISUALIZATION MARKET RESEARCH AND ANALYSIS BY END-USER, 2019-2026 ($ MILLION)
24. ASIA-PACIFIC BIOLOGICAL DATA VISUALIZATION MARKET RESEARCH AND ANALYSIS BY COUNTRY, 2019-2026 ($ MILLION)
25. ASIA-PACIFIC BIOLOGICAL DATA VISUALIZATION MARKET RESEARCH AND ANALYSIS BY TECHNOLOGY, 2019-2026 ($ MILLION)
26. ASIA-PACIFIC BIOLOGICAL DATA VISUALIZATION MARKET RESEARCH AND ANALYSIS BY APPLICATION, 2019-2026 ($ MILLION)
27. ASIA-PACIFIC BIOLOGICAL DATA VISUALIZATION MARKET RESEARCH AND ANALYSIS BY END-USER, 2019-2026 ($ MILLION)
28. REST OF THE WORLD BIOLOGICAL DATA VISUALIZATION MARKET RESEARCH AND ANALYSIS BY TECHNOLOGY, 2019-2026 ($ MILLION)
29. REST OF THE WORLD BIOLOGICAL DATA VISUALIZATION MARKET RESEARCH AND ANALYSIS BY APPLICATION, 2019-2026 ($ MILLION)
30. REST OF THE WORLD BIOLOGICAL DATA VISUALIZATION MARKET RESEARCH AND ANALYSIS BY END-USER, 2019-2026 ($ MILLION)
1. GLOBAL BIOLOGICAL DATA VISUALIZATION MARKET SHARE BY TECHNOLOGY, 2019 VS 2026 (%)
2. GLOBAL BIOLOGICAL DATA VISUALIZATION MARKET SHARE BY APPLICATION, 2019 VS 2026 (%)
3. GLOBAL BIOLOGICAL DATA VISUALIZATION MARKET SHARE BY END-USER, 2019 VS 2026 (%)
4. GLOBAL BIOLOGICAL DATA VISUALIZATION MARKET SHARE BY GEOGRAPHY, 2019 VS 2026 (%)
5. US BIOLOGICAL DATA VISUALIZATION MARKET SIZE, 2019-2026 ($ MILLION)
6. CANADA BIOLOGICAL DATA VISUALIZATION MARKET SIZE, 2019-2026 ($ MILLION)
7. UK BIOLOGICAL DATA VISUALIZATION MARKET SIZE, 2019-2026 ($ MILLION)
8. FRANCE BIOLOGICAL DATA VISUALIZATION MARKET SIZE, 2019-2026 ($ MILLION)
9. GERMANY BIOLOGICAL DATA VISUALIZATION MARKET SIZE, 2019-2026 ($ MILLION)
10. ITALY BIOLOGICAL DATA VISUALIZATION MARKET SIZE, 2019-2026 ($ MILLION)
11. SPAIN BIOLOGICAL DATA VISUALIZATION MARKET SIZE, 2019-2026 ($ MILLION)
12. ROE BIOLOGICAL DATA VISUALIZATION MARKET SIZE, 2019-2026 ($ MILLION)
13. INDIA BIOLOGICAL DATA VISUALIZATION MARKET SIZE, 2019-2026 ($ MILLION)
14. CHINA BIOLOGICAL DATA VISUALIZATION MARKET SIZE, 2019-2026 ($ MILLION)
15. JAPAN BIOLOGICAL DATA VISUALIZATION MARKET SIZE, 2019-2026 ($ MILLION)
16. REST OF ASIA-PACIFIC BIOLOGICAL DATA VISUALIZATION MARKET SIZE, 2019-2026 ($ MILLION)
17. REST OF THE WORLD BIOLOGICAL DATA VISUALIZATION MARKET SIZE, 2019-2026 ($ MILLION)


