Automated Container Terminal Market
Global Automated Container Terminal Market Size, Share & Trends Analysis Report, By Automation (Semi-Automated and Fully Automated), By Project Type (Greenfield and Brownfield), By Offering (Software and Services, and Equipment) and Forecast, 2019-2025 Update Available - Forecast 2025-2035
The global automated container terminal market is estimated to grow at a CAGR of more than 4.0% during the forecast period. The major factors contributing to the growth of the market include the significant rise in maritime trade activities and rising automation in ports. As per the United Nations Conference on Trade and Development (UNCTAD), In 2017, the global port activity and cargo handling of bulk and containerized cargo increased rapidly. This expansion was in line with positive trends in the world economy and seaborne trade. The global container terminals boasted an increase in the volume of about 6% during the year, up from 2.1% in 2016.
World container port throughput stood at 752 million twenty-foot equivalent units (TEUs), reflecting an additional 42.3 million TEUs in 2017, an amount comparable to the port throughput of Shanghai, the world’s busiest port. However, the port activity affected year over year due to the unstable economic and political conditions. Nearly 80% of the international trade is carried by sea which is handled by ports across the globe. Therefore, the port operators are working on modernizing port operations, which include cargo handling. Most of the seaports have started automation with crane motion control. Steady growth in maritime trade and a consequent increase in the size of ships, ports, and associated machinery, dockside cranes have become too large and cumbersome for manual control alone.
The applications of crane handling including steady luffing and anti-sway control and smooth lifting and lowering can be performed using advanced motor control systems. As container terminals are designed for higher productivity and more efficient operation, automation is supporting these major improvements all across the globe. A large number of terminals are focusing on the integration of automated solutions to fulfil the challenge associated with taller cranes and larger ships. The RWG and APMT container terminals at Maasvlakte 2, a civil engineering project in the port of Rotterdam (The Netherlands) are completely automated and unmanned. This involves the use of robots, with a height of over 125 metres.
Market Segmentation
The global automated container terminal market is segmented based on automation, project type, and offering. Based on automation, the market is classified into semi-automated and fully automated. Based on the project type, the market is classified into greenfield and brownfield. Based on offering, the market is classified into software and services, and equipment.
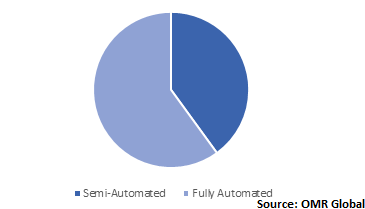
Semi-automated container terminals are anticipated to have a major share in the automation segment
Semi-automated container terminals are estimated to hold a significant share in 2018. A semi-automated container terminal automates the function of cargo-handling lifting in the yard automated stacking cranes (ASCs), however, the horizontal movement and transportation of containers from the berth to the stacks in the yard are carried out by traditional yard tractors which are driven by longshore workers. In case of disruptive events, completely automated machines can show slight resilience, which makes semi-automated terminals an appropriate option for minimizing risk. As a result, several port operators are focusing on semi-automated terminals to maintain a proper balance between manned and unmanned operations and achieve higher productivity.
Global Automated Container Terminal Market Share by Automation, 2018 (%)

Regional Outlook
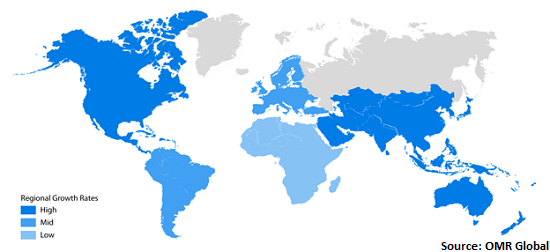
The global automated container terminal market is classified into North America, Europe, Asia-Pacific, and Rest of the World. Asia-Pacific is estimated to witness potential growth during the forecast period owing to the rising government initiatives to improve port infrastructure and emerging focus on automation in the ports. China’s Belt and Road Initiative (BRI) is one of the infrastructure projects introduced in 2013 by President Xi Jinping. Under the initiative, the country is spending nearly $1 trillion that aims to connect ports and trade hubs from the Pacific to Northern Europe. As the country’s exports are increasing, the country is significantly improving maritime transportation, which in turn, is accelerating the need for automation in ports. In April 2018, the biggest automated port terminal across the globe opens in Shanghai. This new terminal can handle 6.3 million 20-foot shipping containers, weighing up to 136 million tons in a year.
Global Automated Container Terminal Market Growth, by Region 2019-2025

Market Players Outlook
Some crucial players operating in the market include ABB Group, Cargotec Group, Konecranes Oyj, Liebherr Group, and Shanghai Zhenhua Heavy Industries Co., Ltd. These companies are adopting several strategies, including mergers and acquisitions, product launches, and partnerships and collaborations, to expand market share and gain a competitive advantage. For instance, in September 2019, Tideworks Technology Inc. (Tideworks), a provider of comprehensive terminal operating system solutions, entered into a partnership with Liebherr Container Cranes Ltd. (LCC) for their solutions to the container handling industry. This will enable Tideworks to offer terminal operators with a streamlined solution to meet their equipment and technology needs.
The Report Covers
- Market value data analysis of 2018 and forecast to 2025.
- Annualized market revenues ($ million) for each market segment.
- Country-wise analysis of major geographical regions.
- Key companies operating in the global automated container terminal market. Based on the availability of data, information related to pipeline products, and relevant news is also available in the report.
- Analysis of business strategies by identifying the key market segments positioned for strong growth in the future.
- Analysis of market-entry and market expansion strategies.
- Competitive strategies by identifying ‘who-stands-where’ in the market.
1. Report Summary
1.1. Research Methods and Tools
1.2. Market Breakdown
1.2.1. By Segments
1.2.2. By Geography
2. Market Overview and Insights
2.1. Scope of the Report
2.2. Analyst Insight & Current Market Trends
2.2.1. Key Findings
2.2.2. Recommendations
2.2.3. Conclusion
3. Competitive Landscape
3.1. Company Share Analysis
3.2. Key Strategy Analysis
3.3. Key Company Analysis
3.3.1. ABB Group
3.3.1.1. Overview
3.3.1.2. Financial Analysis
3.3.1.3. SWOT Analysis
3.3.1.4. Recent Developments
3.3.2. Cargotec Corp.
3.3.2.1. Overview
3.3.2.2. Financial Analysis
3.3.2.3. SWOT Analysis
3.3.2.4. Recent Developments
3.3.3. Konecranes Oyj
3.3.3.1. Overview
3.3.3.2. Financial Analysis
3.3.3.3. SWOT Analysis
3.3.3.4. Recent Developments
3.3.4. Liebherr Group
3.3.4.1. Overview
3.3.4.2. Financial Analysis
3.3.4.3. SWOT Analysis
3.3.4.4. Recent Developments
3.3.5. Shanghai Zhenhua Heavy Industries Co., Ltd.
3.3.5.1. Overview
3.3.5.2. Financial Analysis
3.3.5.3. SWOT Analysis
3.3.5.4. Recent Developments
4. Market Determinants
4.1 Motivators
4.2 Restraints
4.3 Opportunities
5. Market Segmentation
5.1. Global Automated Container Terminal Market by Automation
5.1.1. Semi-Automated
5.1.2. Fully Automated
5.2. Global Automated Container Terminal Market by Project Type
5.2.1. Greenfield
5.2.2. Brownfield
5.3. Global Automated Container Terminal Market by Offering
5.3.1. Software and Services
5.3.2. Equipment
6. Regional Analysis
6.1. North America
6.1.1. United States
6.1.2. Canada
6.2. Europe
6.2.1. UK
6.2.2. Germany
6.2.3. Italy
6.2.4. Spain
6.2.5. France
6.2.6. Rest of Europe
6.3. Asia-Pacific
6.3.1. China
6.3.2. India
6.3.3. Japan
6.3.4. Rest of Asia-Pacific
6.4. Rest of the World
7. Company Profiles
7.1. ABB Group
7.2. Camco Technologies
7.3. Cargotec Corp.
7.4. CyberLogitec Co., Ltd.
7.5. Huawei Co., Ltd.
7.6. Identec Solutions AG
7.7. INFORM GmbH
7.8. Infyz Solutions Pvt Ltd.
7.9. Konecranes Oyj
7.10. Künz GmbH
7.11. Liebherr Group
7.12. Logstar ERP
7.13. ORBCOMM Inc.
7.14. Orbita Ingenieria S.L.
7.15. PACECO CORP.
7.16. Shanghai Zhenhua Heavy Industries Co., Ltd.
7.17. Siemens AG
7.18. Tideworks Technology Inc.
7.19. Total Soft Bank Ltd (TSB)
7.20. Toyota Industries Corp.
1. GLOBAL AUTOMATED CONTAINER TERMINAL MARKET RESEARCH AND ANALYSIS BY AUTOMATION, 2018-2025 ($ MILLION)
2. GLOBAL SEMI-AUTOMATED CONTAINER TERMINAL MARKET RESEARCH AND ANALYSIS BY REGION, 2018-2025 ($ MILLION)
3. GLOBAL FULLY-AUTOMATED CONTAINER TERMINAL MARKET RESEARCH AND ANALYSIS BY REGION, 2018-2025 ($ MILLION)
4. GLOBAL AUTOMATED CONTAINER TERMINAL MARKET RESEARCH AND ANALYSIS BY PROJECT TYPE, 2018-2025 ($ MILLION)
5. GLOBAL AUTOMATED CONTAINER TERMINAL IN GREENFIELD MARKET RESEARCH AND ANALYSIS BY REGION, 2018-2025 ($ MILLION)
6. GLOBAL AUTOMATED CONTAINER TERMINAL IN BROWNFIELD MARKET RESEARCH AND ANALYSIS BY REGION, 2018-2025 ($ MILLION)
7. GLOBAL AUTOMATED CONTAINER TERMINAL MARKET RESEARCH AND ANALYSIS BY OFFERING, 2018-2025 ($ MILLION)
8. GLOBAL AUTOMATED CONTAINER TERMINAL SOFTWARE AND SERVICES MARKET RESEARCH AND ANALYSIS BY REGION, 2018-2025 ($ MILLION)
9. GLOBAL AUTOMATED CONTAINER TERMINAL EQUIPMENT MARKET RESEARCH AND ANALYSIS BY REGION, 2018-2025 ($ MILLION)
10. GLOBAL AUTOMATED CONTAINER TERMINAL MARKET RESEARCH AND ANALYSIS BY GEOGRAPHY, 2018-2025 ($ MILLION)
11. NORTH AMERICAN AUTOMATED CONTAINER TERMINAL MARKET RESEARCH AND ANALYSIS BY COUNTRY, 2018-2025 ($ MILLION)
12. NORTH AMERICAN AUTOMATED CONTAINER TERMINAL MARKET RESEARCH AND ANALYSIS BY AUTOMATION, 2018-2025 ($ MILLION)
13. NORTH AMERICAN AUTOMATED CONTAINER TERMINAL MARKET RESEARCH AND ANALYSIS BY PROJECT TYPE, 2018-2025 ($ MILLION)
14. NORTH AMERICAN AUTOMATED CONTAINER TERMINAL MARKET RESEARCH AND ANALYSIS BY OFFERING, 2018-2025 ($ MILLION)
15. EUROPEAN AUTOMATED CONTAINER TERMINAL MARKET RESEARCH AND ANALYSIS BY COUNTRY, 2018-2025 ($ MILLION)
16. EUROPEAN AUTOMATED CONTAINER TERMINAL MARKET RESEARCH AND ANALYSIS BY AUTOMATION, 2018-2025 ($ MILLION)
17. EUROPEAN AUTOMATED CONTAINER TERMINAL MARKET RESEARCH AND ANALYSIS BY PROJECT TYPE, 2018-2025 ($ MILLION)
18. EUROPEAN AUTOMATED CONTAINER TERMINAL MARKET RESEARCH AND ANALYSIS BY OFFERING, 2018-2025 ($ MILLION)
19. ASIA-PACIFIC AUTOMATED CONTAINER TERMINAL MARKET RESEARCH AND ANALYSIS BY COUNTRY, 2018-2025 ($ MILLION)
20. ASIA-PACIFIC AUTOMATED CONTAINER TERMINAL MARKET RESEARCH AND ANALYSIS BY AUTOMATION, 2018-2025 ($ MILLION)
21. ASIA-PACIFIC AUTOMATED CONTAINER TERMINAL MARKET RESEARCH AND ANALYSIS BY PROJECT TYPE, 2018-2025 ($ MILLION)
22. ASIA-PACIFIC AUTOMATED CONTAINER TERMINAL MARKET RESEARCH AND ANALYSIS BY OFFERING, 2018-2025 ($ MILLION)
23. REST OF THE WORLD AUTOMATED CONTAINER TERMINAL MARKET RESEARCH AND ANALYSIS BY AUTOMATION, 2018-2025 ($ MILLION)
24. REST OF THE WORLD AUTOMATED CONTAINER TERMINAL MARKET RESEARCH AND ANALYSIS BY PROJECT TYPE, 2018-2025 ($ MILLION)
25. REST OF THE WORLD AUTOMATED CONTAINER TERMINAL MARKET RESEARCH AND ANALYSIS BY OFFERING, 2018-2025 ($ MILLION)
1. GLOBAL AUTOMATED CONTAINER TERMINAL MARKET SHARE BY AUTOMATION, 2018 VS 2025 (%)
2. GLOBAL AUTOMATED CONTAINER TERMINAL MARKET SHARE BY PROJECT TYPE, 2018 VS 2025 (%)
3. GLOBAL AUTOMATED CONTAINER TERMINAL MARKET SHARE BY OFFERING, 2018 VS 2025 (%)
4. GLOBAL AUTOMATED CONTAINER TERMINAL MARKET SHARE BY GEOGRAPHY, 2018 VS 2025 (%)
5. US AUTOMATED CONTAINER TERMINAL MARKET SIZE, 2018-2025 ($ MILLION)
6. CANADA AUTOMATED CONTAINER TERMINAL MARKET SIZE, 2018-2025 ($ MILLION)
7. UK AUTOMATED CONTAINER TERMINAL MARKET SIZE, 2018-2025 ($ MILLION)
8. FRANCE AUTOMATED CONTAINER TERMINAL MARKET SIZE, 2018-2025 ($ MILLION)
9. GERMANY AUTOMATED CONTAINER TERMINAL MARKET SIZE, 2018-2025 ($ MILLION)
10. ITALY AUTOMATED CONTAINER TERMINAL MARKET SIZE, 2018-2025 ($ MILLION)
11. SPAIN AUTOMATED CONTAINER TERMINAL MARKET SIZE, 2018-2025 ($ MILLION)
12. ROE AUTOMATED CONTAINER TERMINAL MARKET SIZE, 2018-2025 ($ MILLION)
13. INDIA AUTOMATED CONTAINER TERMINAL MARKET SIZE, 2018-2025 ($ MILLION)
14. CHINA AUTOMATED CONTAINER TERMINAL MARKET SIZE, 2018-2025 ($ MILLION)
15. JAPAN AUTOMATED CONTAINER TERMINAL MARKET SIZE, 2018-2025 ($ MILLION)
16. REST OF ASIA-PACIFIC AUTOMATED CONTAINER TERMINAL MARKET SIZE, 2018-2025 ($ MILLION)
17. REST OF THE WORLD AUTOMATED CONTAINER TERMINAL MARKET SIZE, 2018-2025 ($ MILLION)


