Energy And Utilities Analytics Market
Global Energy And Utilities Analytics Market Size, Share & Trends Analysis Report by Deployment Type (Cloud-Based and On-Premises), By Industry (Energy and Utilities) and Forecast 2020-2026 Update Available - Forecast 2025-2035
The global market for energy and utilities analytics is projected to have considerable CAGR of 16.5% during the forecast period. The major factors that propels the energy and utilities analytics market include growing deployment of smart meters across the globe coupled with growing analytics solution in energy and utilities sectors. Governments across the globe including North American, European as well as Asia-Pacific countries are taking every possible step to install smart meters in every utilities industry such as gas water and electric. For instance, the US government is taking immense steps to install every household and industry with smart meters according to the US Energy Information Administration. Moreover, increasing deployment of advanced metering infrastructure for the two way communication between service provider and consumers for better customers experience further propels the market growth during the forecast period. Moreover, deployment of AI and IoT in energy management further provide substantial opportunity to the market.
Segmental Outlook
The global energy and utilities analytics market is segmented based on deployment type and industry. Based on the deployment type, the market is further classified into cloud-based and on-premises. The cloud based segment is projected to grow at a significant CAGR during the forecast period. The energy and utilities sector are adopting cloud based analytics software due to cost effectiveness and scalability benefits. On the basis of industry the market is further segregated into energy and utilities.
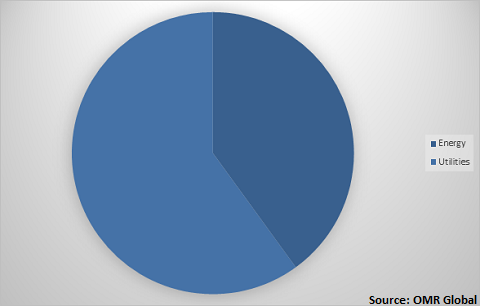
Global energy and utilities analytics Market Share by Industry, 2019(%)

Global energy and utilities analytics market to be driven by utilities Industry
Among industry, the utilities segment held a considerable share in the market owing to the significant rise in the deployment of smart meters coupled with growing demand of analytics software in utilities industry. For managing this, utilities, independent power producers and other energy companies are exploring effective ways. The companies are leveraging analytics software for improving the accessibility and efficiency of utility distribution moreover rising smart infrastructure across the further propels the segmental growth. Cities already consume a majority of energy and other resources and this consumption is gradually rising. All these factors are forcing countries across the globe to look forward to smart cities as a possible solution. For instance, in 2015, the government of India launched smart city mission to modernize the existing tier 1 and tier 2 city so that better utilization of the resources can be done, as a part of this project India is considering a plan to install smart meters in every home and business.
Regional Outlook
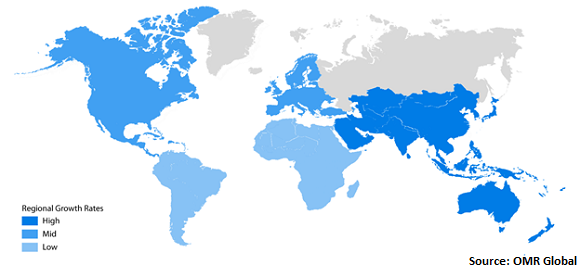
Geographically, the global energy and utilities analytics market is further classified into North America, Europe, Asia-Pacific and the Rest of the World. Asia-Pacific is estimated to have considerable market growth in the global market during the forecast period. The market growth is attributed to the significant adoption of analytics solutions in economies such as China, Japan, India, South Korea, Thailand, and Australia. The increasing internet penetration has increased the deployment of connected devices, which in turn, is expected to drive the adoption of energy and utilities analytics technology in the region.
Global energy and utilities analytics Market Growth, by Region 2020-2026

North America to hold a considerable share in the global energy and utilities analytics market
Geographically, North America is projected to hold a significant market share in the global energy and utilities analytics market. Major economies which are anticipated to contribute to the North America energy and utilities analytics market are the US and Canada. The developed technological infrastructure and economic strength of the North America provides a substantial platform for the growth of the market. The high adoption of cloud-based analytics solutions in the region has led to a substantial growth in the market. The government-driven initiatives to offer smart solutions in utility supply are further fueling the market growth in the region. Syncing of these smart meters with smartphone to perform easy remote monitoring of utility supply in North America is again making a remarkable contribution to the market growth in the region. The US has made a considerable contribution to the market growth owing to the rising investment for smart solutions and smart grid systems by the energy and utilities sector in the region.
Market Players Outlook
The key players in the energy and utilities analytics market contributing significantly by providing different types of deployments and increasing their geographical presence across the globe. The key players of the market include Microsoft Corp., Eaton Corp., IBM Corp., SAP SE, Oracle Corp., Amazon Web Services, Inc., General Electric Co, Intel Corp., Schneider Electric SE, and others. These market players adopt various strategies such as deployment launch, partnerships, collaborations, mergers, and acquisitions to sustain a strong position in the market.
The Report Covers
- Market value data analysis of 2019 and forecast to 2026.
- Annualized market revenues ($ million) for each market segment.
- Country-wise analysis of major geographical regions.
- Key companies operating in the global energy and utilities analytics market. Based on the availability of data, information related to pipeline deployments, and relevant news is also available in the report.
- Analysis of business strategies by identifying the key market segments positioned for strong growth in the future.
- Analysis of market-entry and market expansion strategies.
- Competitive strategies by identifying ‘who-stands-where’ in the market.
1. Report Summary
1.1. Research Methods and Tools
1.2. Market Breakdown
1.2.1. By Segments
1.2.2. By Geography
2. Market Overview and Insights
2.1. Scope of the Report
2.2. Analyst Insight & Current Market Trends
2.2.1. Key Findings
2.2.2. Recommendations
2.2.3. Conclusion
2.3. Rules & Regulations
3. Competitive Landscape
3.1. Company Share Analysis
3.2. Key Strategy Analysis
3.3. Key Company Analysis
3.3.1. Microsoft Corp.
3.3.1.1. Overview
3.3.1.2. Financial Analysis
3.3.1.3. SWOT Analysis
3.3.1.4. Recent Developments
3.3.2. Eaton Corp.
3.3.2.1. Overview
3.3.2.2. Financial Analysis
3.3.2.3. SWOT Analysis
3.3.2.4. Recent Developments
3.3.3. IBM Corp.
3.3.3.1. Overview
3.3.3.2. Financial Analysis
3.3.3.3. SWOT Analysis
3.3.3.4. Recent Developments
3.3.4. SAP SE
3.3.4.1. Overview
3.3.4.2. Financial Analysis
3.3.4.3. SWOT Analysis
3.3.4.4. Recent Developments
3.3.5. Oracle Corp.
3.3.5.1. Overview
3.3.5.2. Financial Analysis
3.3.5.3. SWOT Analysis
3.3.5.4. Recent Developments
4. Market Determinants
4.1. Motivators
4.2. Restraints
4.3. Opportunities
5. Market Segmentation
5.1. Global Energy and Utilities Analytics Market by Deployment Type
5.1.1. Cloud Based
5.1.2. On-Premises
5.2. Global Energy and Utilities Analytics Market by Industry
5.2.1. Energy
5.2.2. Utilities
6. Regional Analysis
6.1. North America
6.1.1. United States
6.1.2. Canada
6.2. Europe
6.2.1. UK
6.2.2. Germany
6.2.3. Italy
6.2.4. Spain
6.2.5. France
6.2.6. Rest of Europe
6.3. Asia-Pacific
6.3.1. China
6.3.2. India
6.3.3. Japan
6.3.4. Rest of Asia-Pacific
6.4. Rest of the World
7. Company Profiles
7.1. Amazon Web Services, Inc.
7.2. Atos SE
7.3. Alteryx, Inc.
7.4. Cisco Systems, Inc.
7.5. Eaton Corp.
7.6. General Electric Co.
7.7. Google LLC
7.8. IBM Corp.
7.9. Intel Corp.
7.10. Microsoft Corp.
7.11. MicroStrategy Inc.
7.12. Oracle Corp.
7.13. Open Text Corp.
7.14. SAP SE
7.15. SAS Institute Inc.
7.16. Salesforce.com, inc.
7.17. Schneider Electric SE
7.18. Siemens AG
7.19. Teradata Operations, Inc.
7.20. TIBCO Software Inc.
1. GLOBAL ENERGY AND UTILITIES ANALYTICS MARKET RESEARCH AND ANALYSIS BY DEPLOYMENT TYPE, 2019-2026 ($ MILLION)
2. GLOBAL CLOUD-BASED ENERGY AND UTILITIES ANALYTICS MARKET RESEARCH AND ANALYSIS BY REGION, 2019-2026 ($ MILLION)
3. GLOBAL ON-PREMISES ENERGY AND UTILITIES ANALYTICS MARKET RESEARCH AND ANALYSIS BY REGION, 2019-2026 ($ MILLION)
4. GLOBAL ENERGY AND UTILITIES ANALYTICS MARKET RESEARCH AND ANALYSIS BY INDUSTRY, 2019-2026 ($ MILLION)
5. GLOBAL ENERGY ANALYTICS MARKET RESEARCH AND ANALYSIS BY REGION, 2019-2026 ($ MILLION)
6. GLOBAL UTILITIES ANALYTICS MARKET RESEARCH AND ANALYSIS BY REGION, 2019-2026 ($ MILLION)
7. GLOBAL ENERGY AND UTILITIES ANALYTICS MARKET RESEARCH AND ANALYSIS BY GEOGRAPHY, 2019-2026 ($ MILLION)
8. NORTH AMERICAN ENERGY AND UTILITIES ANALYTICS MARKET RESEARCH AND ANALYSIS BY COUNTRY, 2019-2026 ($ MILLION)
9. NORTH AMERICAN ENERGY AND UTILITIES ANALYTICS MARKET RESEARCH AND ANALYSIS BY DEPLOYMENT TYPE, 2019-2026 ($ MILLION)
10. NORTH AMERICAN ENERGY AND UTILITIES ANALYTICS MARKET RESEARCH AND ANALYSIS BY INDUSTRY, 2019-2026 ($ MILLION)
11. EUROPEAN ENERGY AND UTILITIES ANALYTICS MARKET RESEARCH AND ANALYSIS BY COUNTRY, 2019-2026 ($ MILLION)
12. EUROPEAN ENERGY AND UTILITIES ANALYTICS MARKET RESEARCH AND ANALYSIS BY DEPLOYMENT TYPE, 2019-2026 ($ MILLION)
13. EUROPEAN ENERGY AND UTILITIES ANALYTICS MARKET RESEARCH AND ANALYSIS BY INDUSTRY, 2019-2026 ($ MILLION)
14. ASIA-PACIFIC ENERGY AND UTILITIES ANALYTICS MARKET RESEARCH AND ANALYSIS BY COUNTRY, 2019-2026 ($ MILLION)
15. ASIA-PACIFIC ENERGY AND UTILITIES ANALYTICS MARKET RESEARCH AND ANALYSIS BY DEPLOYMENT TYPE, 2019-2026 ($ MILLION)
16. ASIA-PACIFIC ENERGY AND UTILITIES ANALYTICS MARKET RESEARCH AND ANALYSIS BY INDUSTRY, 2019-2026 ($ MILLION)
17. REST OF THE WORLD ENERGY AND UTILITIES ANALYTICS MARKET RESEARCH AND ANALYSIS BY DEPLOYMENT TYPE, 2019-2026 ($ MILLION)
18. REST OF THE WORLD ENERGY AND UTILITIES ANALYTICS MARKET RESEARCH AND ANALYSIS BY INDUSTRY, 2019-2026 ($ MILLION)
1. GLOBAL ENERGY AND UTILITIES ANALYTICS MARKET SHARE BY DEPLOYMENT TYPE, 2019 VS 2026 (%)
2. GLOBAL ENERGY AND UTILITIES ANALYTICS MARKET SHARE BY INDUSTRY, 2019 VS 2026 (%)
3. GLOBAL ENERGY AND UTILITIES ANALYTICS MARKET SHARE BY GEOGRAPHY, 2019 VS 2026 (%)
4. US ENERGY AND UTILITIES ANALYTICS MARKET SIZE, 2019-2026 ($ MILLION)
5. CANADA ENERGY AND UTILITIES ANALYTICS MARKET SIZE, 2019-2026 ($ MILLION)
6. UK ENERGY AND UTILITIES ANALYTICS MARKET SIZE, 2019-2026 ($ MILLION)
7. FRANCE ENERGY AND UTILITIES ANALYTICS MARKET SIZE, 2019-2026 ($ MILLION)
8. GERMANY ENERGY AND UTILITIES ANALYTICS MARKET SIZE, 2019-2026 ($ MILLION)
9. ITALY ENERGY AND UTILITIES ANALYTICS MARKET SIZE, 2019-2026 ($ MILLION)
10. SPAIN ENERGY AND UTILITIES ANALYTICS MARKET SIZE, 2019-2026 ($ MILLION)
11. ROE ENERGY AND UTILITIES ANALYTICS MARKET SIZE, 2019-2026 ($ MILLION)
12. INDIA ENERGY AND UTILITIES ANALYTICS MARKET SIZE, 2019-2026 ($ MILLION)
13. CHINA ENERGY AND UTILITIES ANALYTICS MARKET SIZE, 2019-2026 ($ MILLION)
14. JAPAN ENERGY AND UTILITIES ANALYTICS MARKET SIZE, 2019-2026 ($ MILLION)
15. REST OF ASIA-PACIFIC ENERGY AND UTILITIES ANALYTICS MARKET SIZE, 2019-2026 ($ MILLION)
16. REST OF THE WORLD ENERGY AND UTILITIES ANALYTICS MARKET SIZE, 2019-2026 ($ MILLION)


