Smart Ports Market
Global Smart Ports Market Size, Share & Trends Analysis Report by Port Type (Cargo Ports and Sea Ports) By Throughput Capacity (Extensively busy (above 18 million Teu), Moderately busy (5-18 million Teu), and Scarcely busy (below 5 million Teu)) By Technology (IoT, Blockchain, Artificial Intelligence (AI), and Process Automation) and Forecast, 2019-2025 Update Available - Forecast 2025-2035
The global smart ports market is estimated to grow at a CAGR of nearly 26.0% during the forecast period. The major factors contributing to the growth of the market include a significant rise in the logistics sector and rising demand for automation in ports. A significant rise in the logistics sector has been witnessed in developed and developing countries owing to the rising international trade operations and increasing e-commerce industry. Due to the increase in cross-border e-commerce sales, the demand for maritime transportation has significantly increased over the years. The cross-border business-to-consumer (B2C) sales reached an estimated $412 billion in 2017, which is accounted for nearly 11% of total B2C e-commerce, a 4% hike as compared to 2016.
The top ten countries by B2C e-commerce sales include China, the US, UK, and Japan with nearly $1,062 billion, $753 billion, $206 billion, and $147 billion, respectively. The cross-border e-commerce trade usually requires long-distance transport, which contributes to the demand for maritime transportation. As per the United Nations Conference on Trade and Development, nearly 80% of the international trade is carried out by commercial shipping. This, in turn, increases the need for port terminals to conduct transportation operations more efficiently.
Due to increasing global trade, there is an increasing focus of port operators to add advanced technologies to make operations automatic or semi-automatic. There are a large number of seaports that have been using technological tools for automation in port activities. These ports are ranging from Rotterdam to Yangshan (Shanghai, in China), to Lázaro Cárdenas (in Mexico). It allows to better management and control over the work processes performed at the terminal, with real, prompt information on all operations conducted. The IoT platforms allow port operators to better manage and track containers as well as reduce operational costs and human errors.
Market Segmentation
The global smart ports market is segmented based on port type, throughput capacity, and technology. Based on the port type, the market is classified into cargo ports and sea ports. Based on throughput capacity, the market is classified into extensively busy (above 18 million Teu), moderately busy (5-18 million Teu), and scarcely busy (below 5 million Teu). Based on technology, the market is classified into IoT, blockchain, artificial intelligence (AI), and process automation.
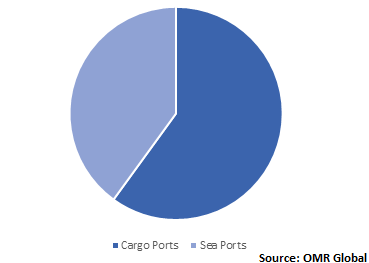
Smart solutions find its significant application in cargo ports
Digital technologies are gaining considerable importance in cargo ports owing to the increasing vessel sizes and cargo volumes that constantly making pressure on ports and terminals to innovate their operations. Smart technologies comprise systems that encourage basic infrastructure, as well as, offers tools to handle cargo, manage traffic, assuring the safety, deal with customs, and monitoring the use of energy. To maintain a competitive edge, port operators to implement smart port technologies to become productive, competitive, efficient, and customer friendly.
In Europe, Rotterdam, Hamburg, and Antwerpen retain their positions as the region’s top three ports in 2017, in terms of the volume of containers handled in the ports and in terms of the gross weight of goods handled. These cargo ports are using smart solutions to analyze weather conditions and water and communications data. For instance, Rotterdam port is using IBM Cloud and IoT solutions to keep track of ship movements, weather, water depth, infrastructure, and geographical data with considerable accuracy.
Global Smart Ports Market Share by Port Type, 2018 (%)

Regional Outlook
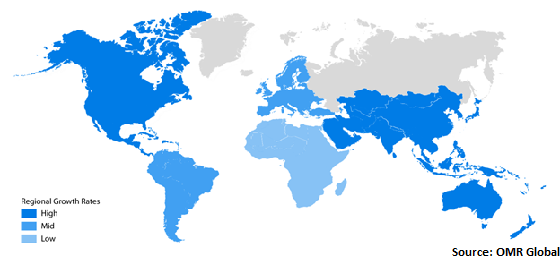
The global smart ports market is segmented into North America, Europe, Asia-Pacific, and Rest of the world (RoW). Europe smart ports market is significantly driven by the significant presence of cargo ports and focus on digitalization technologies in the transportation and logistics sector. Asia-Pacific smart ports market is estimated to witness potential growth during the forecast period owing to the increasing global trade and the presence of major ports with high-throughput capacity in the region. Increasing investment in ports development and logistics sector is further anticipated to drive the market growth in the region.
As per the India Brand Equity Foundation (IBEF), India holds the sixteenth position in maritime countries across the globe, with a coastline of nearly 7,517 km. The government of India is playing a vital role to stimulate the ports activities. As a result, under the automatic route, the Indian government allowed Foreign Direct Investment (FDI) of up to 100% for construction and maintenance of ports and harbors. The government of India is promoting digitalization across the sectors, which in turn, will further support to reinforce the demand for smart technologies in the maritime transportation sector.
Global Smart Ports Market Growth, by Region 2019-2025

Market Players Outlook
Some crucial players operating in the market include IBM Corp., ABB Ltd., General Electric Co., Telefonaktiebolaget LM Ericsson, and Nokia Corp. These players are adopting some crucial strategies, including mergers and acquisitions, product launches, and partnerships and collaborations, to expand market share and gain a competitive advantage over their competitors. For instance, in February 2019, Ericsson and China Unicom, a telecom operator, declared the development of 5G smart harbor at the Qingdao port in China. With the field trial, the major findings were reported that nearly 70% of labor costs of a harbor can be reduced with the use of 5G automation upgrade, rather than conventional harbors using a completely automated solution. Therefore, China Unicom, Ericsson, and other partners have decided to mutually explore the use of 5G networks and solutions for smart ports which covers both the transformation of traditional ports and automated ports.
The Report Covers
- Market value data analysis of 2018 and forecast to 2025.
- Annualized market revenues ($ million) for each market segment.
- Country-wise analysis of major geographical regions.
- Key companies operating in the global smart ports market. Based on the availability of data, information related to pipeline products, and relevant news is also available in the report.
- Analysis of business strategies by identifying the key market segments positioned for strong growth in the future.
- Analysis of market-entry and market expansion strategies.
- Competitive strategies by identifying ‘who-stands-where’ in the market.
1. Report Summary
1.1. Research Methods and Tools
1.2. Market Breakdown
1.2.1. By Segments
1.2.2. By Geography
2. Market Overview and Insights
2.1. Scope of the Report
2.2. Analyst Insight & Current Market Trends
2.2.1. Key Findings
2.2.2. Recommendations
2.2.3. Conclusion
3. Competitive Landscape
3.1. Company Share Analysis
3.2. Key Strategy Analysis
3.3. Key Company Analysis
3.3.1. IBM Corp.
3.3.1.1. Overview
3.3.1.2. Financial Analysis
3.3.1.3. SWOT Analysis
3.3.1.4. Recent Developments
3.3.2. ABB Ltd.
3.3.2.1. Overview
3.3.2.2. Financial Analysis
3.3.2.3. SWOT Analysis
3.3.2.4. Recent Developments
3.3.3. General Electric Co.
3.3.3.1. Overview
3.3.3.2. Financial Analysis
3.3.3.3. SWOT Analysis
3.3.3.4. Recent Developments
3.3.4. Telefonaktiebolaget LM Ericsson
3.3.4.1. Overview
3.3.4.2. Financial Analysis
3.3.4.3. SWOT Analysis
3.3.4.4. Recent Developments
3.3.5. Nokia Corp.
3.3.5.1. Overview
3.3.5.2. Financial Analysis
3.3.5.3. SWOT Analysis
3.3.5.4. Recent Developments
4. Market Determinants
4.1 Motivators
4.2 Restraints
4.3 Opportunities
5. Market Segmentation
5.1. Global Smart Ports Market by Port Type
5.1.1. Cargo Ports
5.1.2. Sea Ports
5.2. Global Smart Ports Market by Throughput Capacity
5.2.1. Extensively busy (above 18 million Teu)
5.2.2. Moderately busy (5-18 million Teu)
5.2.3. Scarcely busy (below 5 million Teu)
5.3. Global Smart Ports Market by Technology
5.3.1. Internet of Things (IoT)
5.3.2. Blockchain
5.3.3. Artificial Intelligence (AI)
5.3.4. Process Automation
6. Regional Analysis
6.1. North America
6.1.1. United States
6.1.2. Canada
6.2. Europe
6.2.1. UK
6.2.2. Germany
6.2.3. Italy
6.2.4. Spain
6.2.5. France
6.2.6. Rest of Europe
6.3. Asia-Pacific
6.3.1. China
6.3.2. India
6.3.3. Japan
6.3.4. Rest of Asia-Pacific
6.4. Rest of the World
7. Company Profiles
7.1. ABB Ltd.
7.2. Abu Dhabi Ports
7.3. Accenture plc
7.4. Cisco Systems, Inc.
7.5. Envision Enterprise Solutions Pvt. Ltd.
7.6. General Electric Co.
7.7. IBM Corp.
7.8. Ikusi Redes de Telecomunicaciones, S.L.
7.9. leogistics GmbH
7.10. Nokia Corp.
7.11. Port of Rotterdam
7.12. Ramboll Group A/S
7.13. Royal HaskoningDHV
7.14. Scientific Enterprises Ltd.
7.15. Siemens AG
7.16. Telefonaktiebolaget LM Ericsson
7.17. TRAXENS
7.18. Trelleborg AB
7.19. Wipro Ltd.
7.20. ZPMC Shanghai Zhenhua Heavy industries Co.Ltd.
1. GLOBAL SMART PORTS MARKET RESEARCH AND ANALYSIS BY PORT TYPE, 2018-2025 ($ MILLION)
2. GLOBAL SMART CARGO PORTS MARKET RESEARCH AND ANALYSIS BY REGION, 2018-2025 ($ MILLION)
3. GLOBAL SMART SEA PORTS MARKET RESEARCH AND ANALYSIS BY REGION, 2018-2025 ($ MILLION)
4. GLOBAL SMART PORTS MARKET RESEARCH AND ANALYSIS BY THROUGHPUT CAPACITY, 2018-2025 ($ MILLION)
5. GLOBAL EXTENSIVELY BUSY (ABOVE 18 MILLION TEU) SMART PORTS MARKET RESEARCH AND ANALYSIS BY REGION, 2018-2025 ($ MILLION)
6. GLOBAL MODERATELY BUSY (5-18 MILLION TEU) SMART PORTS MARKET RESEARCH AND ANALYSIS BY REGION, 2018-2025 ($ MILLION)
7. GLOBAL SCARCELY BUSY (BELOW 5 MILLION TEU) SMART PORTS MARKET RESEARCH AND ANALYSIS BY REGION, 2018-2025 ($ MILLION)
8. GLOBAL SMART PORTS MARKET RESEARCH AND ANALYSIS BY TECHNOLOGY, 2018-2025 ($ MILLION)
9. GLOBAL IOT IN SMART PORTS MARKET RESEARCH AND ANALYSIS BY REGION, 2018-2025 ($ MILLION)
10. GLOBAL BLOCKCHAIN IN SMART PORTS MARKET RESEARCH AND ANALYSIS BY REGION, 2018-2025 ($ MILLION)
11. GLOBAL AI IN SMART PORTS MARKET RESEARCH AND ANALYSIS BY REGION, 2018-2025 ($ MILLION)
12. GLOBAL PROCESS AUTOMATION IN SMART PORTS MARKET RESEARCH AND ANALYSIS BY REGION, 2018-2025 ($ MILLION)
13. GLOBAL SMART PORTS MARKET RESEARCH AND ANALYSIS BY GEOGRAPHY, 2018-2025 ($ MILLION)
14. NORTH AMERICAN SMART PORTS MARKET RESEARCH AND ANALYSIS BY COUNTRY, 2018-2025 ($ MILLION)
15. NORTH AMERICAN SMART PORTS MARKET RESEARCH AND ANALYSIS BY PORT TYPE, 2018-2025 ($ MILLION)
16. NORTH AMERICAN SMART PORTS MARKET RESEARCH AND ANALYSIS BY THROUGHPUT CAPACITY, 2018-2025 ($ MILLION)
17. NORTH AMERICAN SMART PORTS MARKET RESEARCH AND ANALYSIS BY TECHNOLOGY, 2018-2025 ($ MILLION)
18. EUROPEAN SMART PORTS MARKET RESEARCH AND ANALYSIS BY COUNTRY, 2018-2025 ($ MILLION)
19. EUROPEAN SMART PORTS MARKET RESEARCH AND ANALYSIS BY PORT TYPE, 2018-2025 ($ MILLION)
20. EUROPEAN SMART PORTS MARKET RESEARCH AND ANALYSIS BY THROUGHPUT CAPACITY, 2018-2025 ($ MILLION)
21. EUROPEAN SMART PORTS MARKET RESEARCH AND ANALYSIS BY TECHNOLOGY, 2018-2025 ($ MILLION)
22. ASIA-PACIFIC SMART PORTS MARKET RESEARCH AND ANALYSIS BY COUNTRY, 2018-2025 ($ MILLION)
23. ASIA-PACIFIC SMART PORTS MARKET RESEARCH AND ANALYSIS BY PORT TYPE, 2018-2025 ($ MILLION)
24. ASIA-PACIFIC SMART PORTS MARKET RESEARCH AND ANALYSIS BY THROUGHPUT CAPACITY, 2018-2025 ($ MILLION)
25. ASIA-PACIFIC SMART PORTS MARKET RESEARCH AND ANALYSIS BY TECHNOLOGY, 2018-2025 ($ MILLION)
26. REST OF THE WORLD SMART PORTS MARKET RESEARCH AND ANALYSIS BY PORT TYPE, 2018-2025 ($ MILLION)
27. REST OF THE WORLD SMART PORTS MARKET RESEARCH AND ANALYSIS BY THROUGHPUT CAPACITY, 2018-2025 ($ MILLION)
28. REST OF THE WORLD SMART PORTS MARKET RESEARCH AND ANALYSIS BY TECHNOLOGY, 2018-2025 ($ MILLION)
1. GLOBAL SMART PORTS MARKET SHARE BY PORT TYPE, 2018 VS 2025 (%)
2. GLOBAL SMART PORTS MARKET SHARE BY THROUGHPUT CAPACITY, 2018 VS 2025 (%)
3. GLOBAL SMART PORTS MARKET SHARE BY TECHNOLOGY, 2018 VS 2025 (%)
4. GLOBAL SMART PORTS MARKET SHARE BY GEOGRAPHY, 2018 VS 2025 (%)
5. US SMART PORTS MARKET SIZE, 2018-2025 ($ MILLION)
6. CANADA SMART PORTS MARKET SIZE, 2018-2025 ($ MILLION)
7. UK SMART PORTS MARKET SIZE, 2018-2025 ($ MILLION)
8. FRANCE SMART PORTS MARKET SIZE, 2018-2025 ($ MILLION)
9. GERMANY SMART PORTS MARKET SIZE, 2018-2025 ($ MILLION)
10. ITALY SMART PORTS MARKET SIZE, 2018-2025 ($ MILLION)
11. SPAIN SMART PORTS MARKET SIZE, 2018-2025 ($ MILLION)
12. ROE SMART PORTS MARKET SIZE, 2018-2025 ($ MILLION)
13. INDIA SMART PORTS MARKET SIZE, 2018-2025 ($ MILLION)
14. CHINA SMART PORTS MARKET SIZE, 2018-2025 ($ MILLION)
15. JAPAN SMART PORTS MARKET SIZE, 2018-2025 ($ MILLION)
16. REST OF ASIA-PACIFIC SMART PORTS MARKET SIZE, 2018-2025 ($ MILLION)
17. REST OF THE WORLD SMART PORTS MARKET SIZE, 2018-2025 ($ MILLION)


