3D Scanning Market
Global 3D Scanning Market Size, Share & Trends Analysis Report by Product (Hardware (Laser Scanner, Structured Light Scanner, and Optical Scanner) and Software), By Range (Short Range, Medium Range, Long Range), By Application (Healthcare, Aerospace and Defense, Architecture and Engineering, Industrial Manufacturing, Tunnel and Mining, Automotive, Power and Energy, and others), Forecast 2019-2025 Update Available - Forecast 2025-2035
Global 3D scanning market is growing at a CAGR of 10.5% during the forecast period. The market growth is attributed to the high demand for quality inspection in industries such as aerospace and defense, architecture and engineering, and automotive. 3D scanning is a procedure that captures the 3D attributes of an object along with information. The 3D scanning technology is considered as one of the effective tools for inspection and quality control purpose. The 3D scanning plays a crucial role in modeling, surveillance, quality check, and inspection among others. Due to insufficient modeling practices and inappropriate dimensional control procedure, the manufacturing industries are facing several challenges such as cost, safety, and schedule issues.
Further, increasing demand for six sigma quality checks along with cost minimization in manufacturing and other industries are creating huge demand for 3D scanning market. Moreover, the rising application of the 3D scanning in the medical and dental industries sector is further estimated to fuel the market growth. However, the high cost of HD 3D scanners and the presence of alternate cost-effective solutions are expected to restrict market growth. Growing adoption of 3D scanning among SMEs and the availability of consumer 3D scanner devices are generating immense growth opportunities for 3D scanning industry during the forecast period.
Segmental Outlook
The 3D scanning market is segmented on the basis of product, range, and application. On the basis of product, the market is segmented into hardware include the laser scanner, structured light scanner, and optical scanner; and software. The structured light scanner is projected to show lucrative growth during the forecast period owing to its high-precision and speed. These 3D scanners are used in the scanning of a highly complex and structured object where accuracy in coordinate mapping gains utmost priority. For instance, aero-designing, prosthetics, and customary automotive parts designing require accuracy during manufacturing. Based on range, the market is segmented into short-range, medium-range, and long-range. Further, based on application, the market is segmented into healthcare, aerospace and defense, architecture and engineering, industrial manufacturing, tunnel and mining, automotive, power and energy, and others.
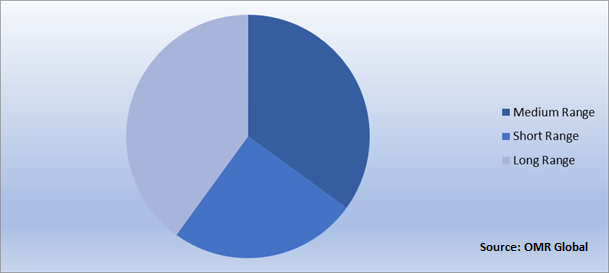
Long Range may hold the largest market size
The long-range segment is estimated to showcase a lucrative growth during the forecast period. The medium-range products of 3D scanning operate within the range of 1-300 meters. These products have numerous applications in the field of industrial manufacturing, civil engineering, automobile sector, heritage, and archeology sectors. Artec Ray, FARO FOCUS 3D X130, LEICA SCANSTATION P15, TRIMBLE CX, and MAPTEK I-SITE 8800 are some of the commercially available long-range 3D laser scanners.
Global 3D Scanning Market Share by Range, 2018 (%)


- Market value data analysis of 2018 and forecast to 2025.
- Annualized market revenues ($ million) for each market segment.
- Country-wise analysis of major geographical regions.
- Key companies operating in the global 3D scanning market. Based on the availability of data, information related to pipeline products, and relevant news is also available in the report.
- Analysis of business strategies by identifying the key market segments positioned for strong growth in the future.
- Analysis of market-entry and market expansion strategies.
- Competitive strategies by identifying ‘who-stands-where’ in the market.
1. Report Summary
1.1. Research Methods and Tools
1.2. Market Breakdown
1.2.1. By Segments
1.2.2. By Geography
2. Market Overview and Insights
2.1. Scope of the Report
2.2. Analyst Insight & Current Market Trends
2.2.1. Key Findings
2.2.2. Recommendations
2.2.3. Conclusion
2.3. Rules & Regulations
3. Competitive Landscape
3.1. Company Share Analysis
3.2. Key Strategy Analysis
3.3. Key Company Analysis
3.3.1. 3D Systems, Inc.
3.3.1.1. Overview
3.3.1.2. Financial Analysis
3.3.1.3. SWOT Analysis
3.3.1.4. Recent Developments
3.3.2. Nikon Metrology N.V.
3.3.2.1. Overview
3.3.2.2. Financial Analysis
3.3.2.3. SWOT Analysis
3.3.2.4. Recent Developments
3.3.3. Autodesk, Inc.
3.3.3.1. Overview
3.3.3.2. Financial Analysis
3.3.3.3. SWOT Analysis
3.3.3.4. Recent Developments
3.3.4. Hexagon AB
3.3.4.1. Overview
3.3.4.2. Financial Analysis
3.3.4.3. SWOT Analysis
3.3.4.4. Recent Developments
3.3.5. Topcon Corp.
3.3.5.1. Overview
3.3.5.2. Financial Analysis
3.3.5.3. SWOT Analysis
3.3.5.4. Recent Developments
4. Market Determinants
4.1 Motivators
4.2 Restraints
4.1. Opportunities
5. Market Segmentation
5.1. Global 3D Scanning Market by Product
5.1.1. Hardware
5.1.1.1. Laser Scanner
5.1.1.2. Structured Light Scanner
5.1.1.3. Optical Scanner
5.1.2. Software
5.2. Global 3D Scanning Market by Range
5.2.1. Short Range
5.2.2. Medium Range
5.2.3. Long Range
5.3. Global 3D Scanning Market by Application
5.3.1. Healthcare
5.3.2. Aerospace and Defense
5.3.3. Architecture and Engineering
5.3.4. Industrial Manufacturing
5.3.5. Tunnel and Mining
5.3.6. Power and Energy
5.3.7. Automotive
5.3.8. Other
6. Regional Analysis
6.1. North America
6.1.1. US
6.1.2. Canada
6.2. Europe
6.2.1. UK
6.2.2. Germany
6.2.3. Italy
6.2.4. Spain
6.2.5. France
6.2.6. Rest of Europe
6.3. Asia-Pacific
6.3.1. China
6.3.2. India
6.3.3. Japan
6.3.4. Rest of Asia-Pacific
6.4. Rest of the World
7. Company Profiles
7.1. 3D Digital Corp.
7.2. 3D Systems, Inc.
7.3. AMETEK, Inc.
7.4. Artec Europe, S.a.r.l.
7.5. Autodesk, Inc.
7.6. Carl Zeiss Optotechnik GmbH
7.7. Direct Dimensions, Inc.
7.8. FARO Technologies, Inc.
7.9. Fuel 3D Technologies, Ltd.
7.10. Hexagon AB
7.11. Konica Minolta, Inc.
7.12. Maptek Pty, Ltd.
7.13. Matter and Form, Inc.
7.14. Nikon Metrology N.V.
7.15. Quality Vision International
7.16. RangeVision
7.17. RIEGL Laser Measurement Systems GmbH
7.18. SHINING 3D Tech. Co., Ltd.
7.19. Surphaser
7.20. Topcon Corp.
7.21. Trimble, Inc.
7.22. XYZprinting, Inc.
1. GLOBAL 3D SCANNING MARKET RESEARCH AND ANALYSIS BY PRODUCT, 2018-2025 ($ MILLION)
2. GLOBAL HARDWARE MARKET RESEARCH AND ANALYSIS BY REGION, 2018-2025 ($ MILLION)
3. GLOBAL SOFTWARE MARKET RESEARCH AND ANALYSIS BY REGION, 2018-2025 ($ MILLION)
4. GLOBAL 3D SCANNING MARKET RESEARCH AND ANALYSIS BY RANGE, 2018-2025 ($ MILLION)
5. GLOBAL SHORT-RANGE MARKET RESEARCH AND ANALYSIS BY REGION, 2018-2025 ($ MILLION)
6. GLOBAL MEDIUM RANGE MARKET RESEARCH AND ANALYSIS BY REGION, 2018-2025 ($ MILLION)
7. GLOBAL LONG-RANGE MARKET RESEARCH AND ANALYSIS BY REGION, 2018-2025 ($ MILLION)
8. GLOBAL 3D SCANNING MARKET RESEARCH AND ANALYSIS BY APPLICATION, 2018-2025 ($ MILLION)
9. GLOBAL HEALTHCARE MARKET RESEARCH AND ANALYSIS BY REGION, 2018-2025 ($ MILLION)
10. GLOBAL AEROSPACE AND DEFENSE MARKET RESEARCH AND ANALYSIS BY REGION, 2018-2025 ($ MILLION)
11. GLOBAL ARCHITECTURE AND ENGINEERING MARKET RESEARCH AND ANALYSIS BY REGION, 2018-2025 ($ MILLION)
12. GLOBAL INDUSTRIAL MANUFACTURING MARKET RESEARCH AND ANALYSIS BY REGION, 2018-2025 ($ MILLION)
13. GLOBAL TUNNEL AND MINING MARKET RESEARCH AND ANALYSIS BY REGION, 2018-2025 ($ MILLION)
14. GLOBAL POWER AND ENERGY MARKET RESEARCH AND ANALYSIS BY REGION, 2018-2025 ($ MILLION)
15. GLOBAL AUTOMOTIVE MARKET RESEARCH AND ANALYSIS BY REGION, 2018-2025 ($ MILLION)
16. GLOBAL OTHER APPLICATION MARKET RESEARCH AND ANALYSIS BY REGION, 2018-2025 ($ MILLION)
17. GLOBAL 3D SCANNING MARKET RESEARCH AND ANALYSIS BY GEOGRAPHY,2018-2025 ($ MILLION)
18. NORTH AMERICAN 3D SCANNING MARKET RESEARCH AND ANALYSIS BY COUNTRY, 2018-2025 ($ MILLION)
19. NORTH AMERICAN 3D SCANNING MARKET RESEARCH AND ANALYSIS BY PRODUCT, 2018-2025 ($ MILLION)
20. NORTH AMERICAN 3D SCANNING MARKET RESEARCH AND ANALYSIS BY RANGE, 2018-2025 ($ MILLION)
21. NORTH AMERICAN 3D SCANNING MARKET RESEARCH AND ANALYSIS BY APPLICATION, 2018-2025 ($ MILLION)
22. EUROPEAN 3D SCANNING MARKET RESEARCH AND ANALYSIS BY COUNTRY, 2018-2025 ($ MILLION)
23. EUROPEAN 3D SCANNING MARKET RESEARCH AND ANALYSIS BY PRODUCT, 2018-2025 ($ MILLION)
24. EUROPEAN 3D SCANNING MARKET RESEARCH AND ANALYSIS BY RANGE, 2018-2025 ($ MILLION)
25. EUROPEAN 3D SCANNING MARKET RESEARCH AND ANALYSIS BY APPLICATION, 2018-2025 ($ MILLION)
26. ASIA-PACIFIC 3D SCANNING MARKET RESEARCH AND ANALYSIS BY COUNTRY, 2018-2025 ($ MILLION)
27. ASIA-PACIFIC 3D SCANNING MARKET RESEARCH AND ANALYSIS BY PRODUCT, 2018-2025 ($ MILLION)
28. ASIA-PACIFIC 3D SCANNING MARKET RESEARCH AND ANALYSIS BY RANGE, 2018-2025 ($ MILLION)
29. ASIA-PACIFIC 3D SCANNING MARKET RESEARCH AND ANALYSIS BY APPLICATION, 2018-2025 ($ MILLION)
30. REST OF THE WORLD 3D SCANNING MARKET RESEARCH AND ANALYSIS BY PRODUCT, 2018-2025 ($ MILLION)
31. REST OF THE WORLD 3D SCANNING MARKET RESEARCH AND ANALYSIS BY RANGE, 2018-2025 ($ MILLION)
32. REST OF THE WORLD 3D SCANNING MARKET RESEARCH AND ANALYSIS BY APPLICATION, 2018-2025 ($ MILLION)
1. GLOBAL 3D SCANNING MARKET SHARE BY PRODUCT, 2018 VS 2025 (%)
2. GLOBAL 3D SCANNING MARKET SHARE BY RANGE, 2018 VS 2025 (%)
3. GLOBAL 3D SCANNING MARKET SHARE BY APPLICATION, 2018 VS 2025 (%)
4. GLOBAL 3D SCANNING MARKET SHARE BY GEOGRAPHY, 2018 VS 2025 (%)
5. US 3D SCANNING MARKET SIZE, 2018-2025 ($ MILLION)
6. CANADA 3D SCANNING MARKET SIZE, 2018-2025 ($ MILLION)
7. UK 3D SCANNING MARKET SIZE, 2018-2025 ($ MILLION)
8. FRANCE 3D SCANNING MARKET SIZE, 2018-2025 ($ MILLION)
9. GERMANY 3D SCANNING MARKET SIZE, 2018-2025 ($ MILLION)
10. ITALY 3D SCANNING MARKET SIZE, 2018-2025 ($ MILLION)
11. SPAIN 3D SCANNING MARKET SIZE, 2018-2025 ($ MILLION)
12. ROE 3D SCANNING MARKET SIZE, 2018-2025 ($ MILLION)
13. INDIA 3D SCANNING MARKET SIZE, 2018-2025 ($ MILLION)
14. CHINA 3D SCANNING MARKET SIZE, 2018-2025 ($ MILLION)
15. JAPAN 3D SCANNING MARKET SIZE, 2018-2025 ($ MILLION)
16. REST OF ASIA-PACIFIC 3D SCANNING MARKET SIZE, 2018-2025 ($ MILLION)
17. REST OF THE WORLD 3D SCANNING MARKET SIZE, 2018-2025 ($ MILLION)


